From Scantron...

Presenter Notes
- Traditionally this was done via Scantron
- But, in 2011, Caktus was approached by the 5E / UChicago team to help build a highly scalable web application in Django
...to Scalable Web App

Presenter Notes
- And, earlier this year, they conducted the first state-wide survey using this tool, for over 2 million parents, students, and teachers
Systems Diagram
Presenter Notes
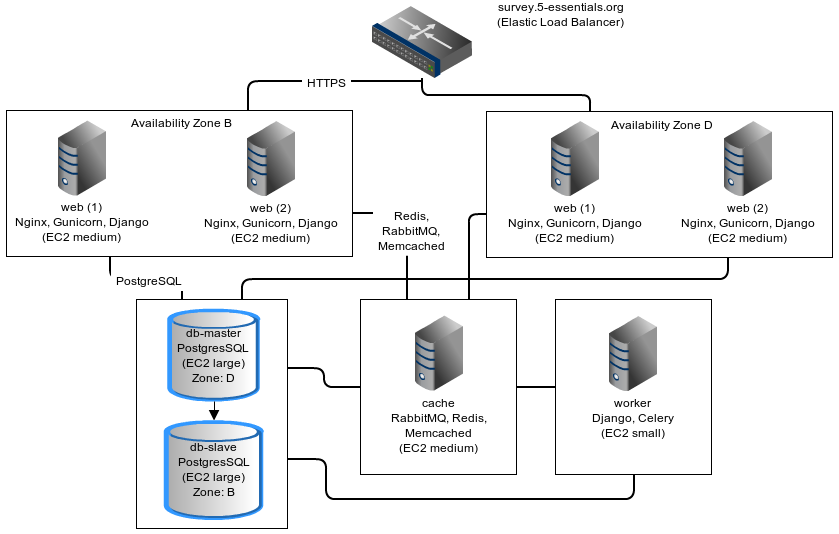
- I'll show this slide again later, but here's a rough outline of what the server infrastructure looked like
- Services are all split out onto separate servers, with the exception of the cache server which runs rabbitmq, redis, and memcached
Step 3: pgfouine
Presenter Notes
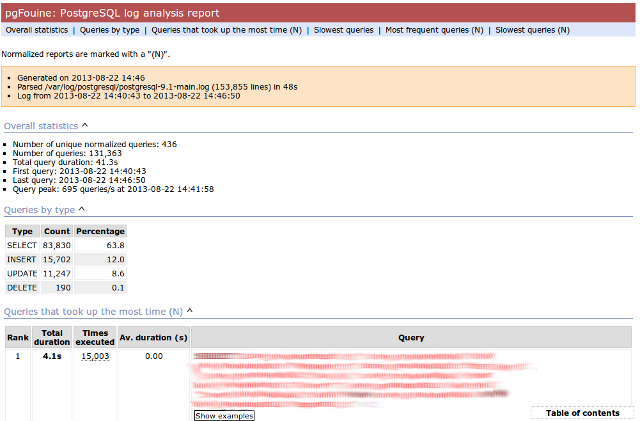
- At the top is some summary information about the number and length of queries run, including a breakdown of queries by type.
- At the bottom, in a sortable list, are all the queries, aggregated by what pgfouine sees as similar, which just means the same queries with potentially different arguments
Step 4: pgfouine, before
Presenter Notes
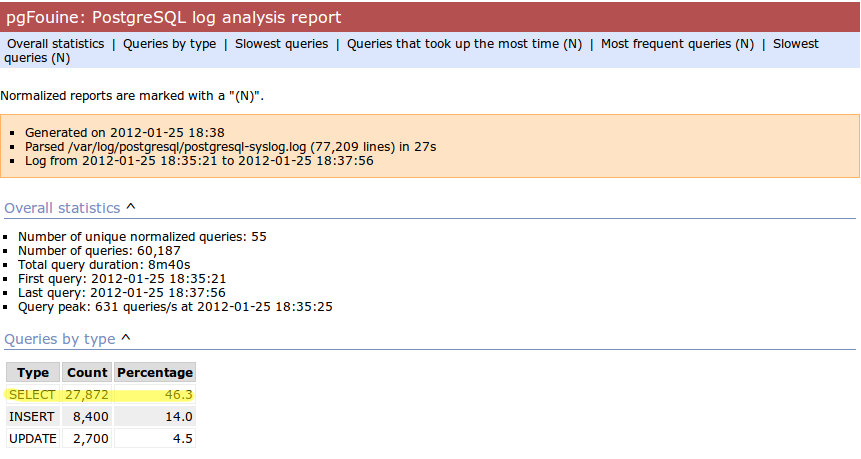
- Here's the output from pgfouine before we enabled caching
Step 4: pgfouine, after
Presenter Notes
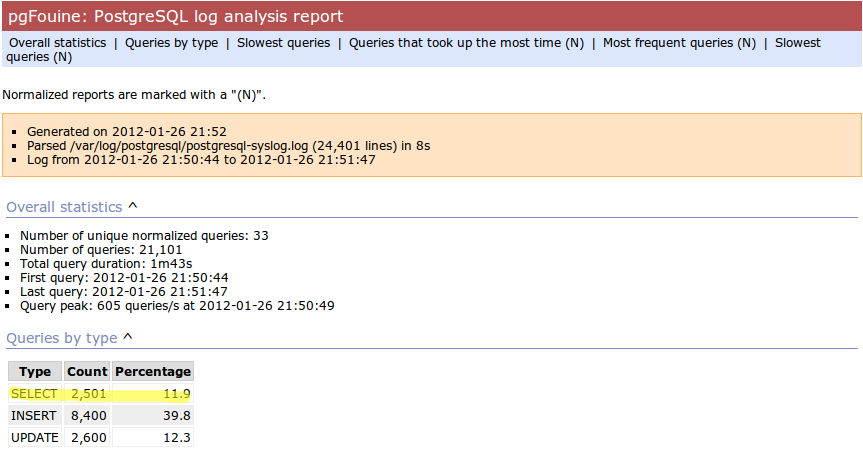
- And here's the output after
- As you can see, a little caching quickly cut the number of SELECT statements by 25,000, to less than 10% of its former value
Server Diagram
Presenter Notes
- As a reminder, here's the server diagram for our systems architecture
Spreadsheet
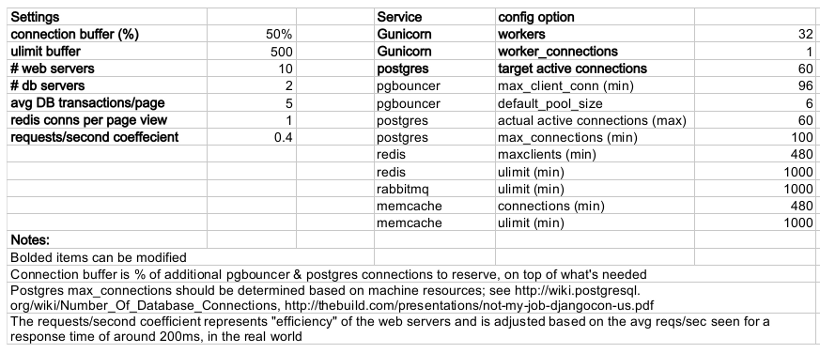
Presenter Notes
- This is a sample of a spreadsheet we put together for this project
- These calculations are all about juggling what you're going to run out of
- For example, 10 web servers, 30 workers on each, that means up to 300 open DB connections
- That's too many, so we use pgbouncer on each of the web servers to share 2 or 3 persistent postgres connections across 30 workers
- There's a link to a google doc you can copy and tweak
survey_change_page, gevent
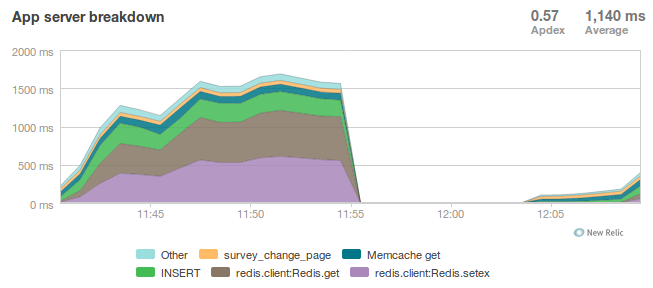
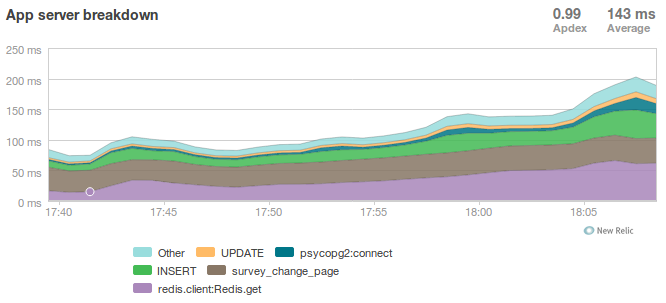
Presenter Notes
- Here's one of the first graphs we saved while load testing, from the main view for survey taking that does the writes to disk
- The big bars are redis GET and SET, which we found somewhat confusing
survey_change_page, sync
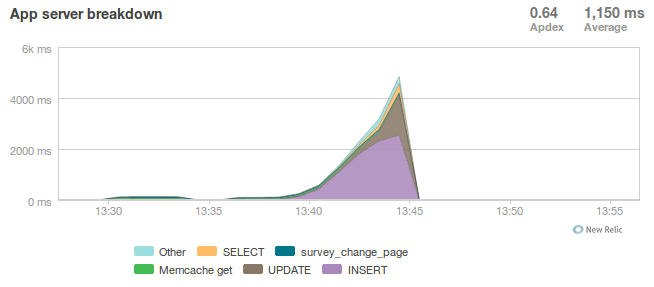
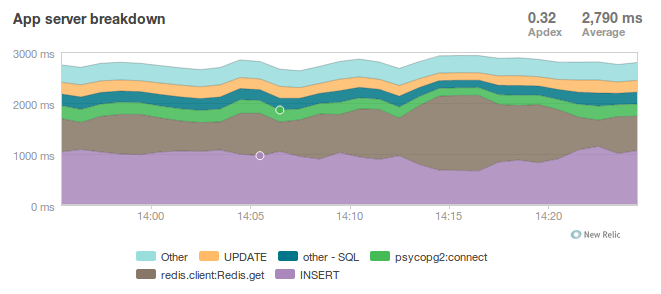
Presenter Notes
- We disabled connection tracking in the firewall and switched to the sync worker
- Bottleneck immediately transferred to the database INSERT statement
- What is happening here?
Database Reponse Time
Presenter Notes
- As you can see, DB response time sky rockets, and the server eventually crashes before the test is complete
Database Falls Over
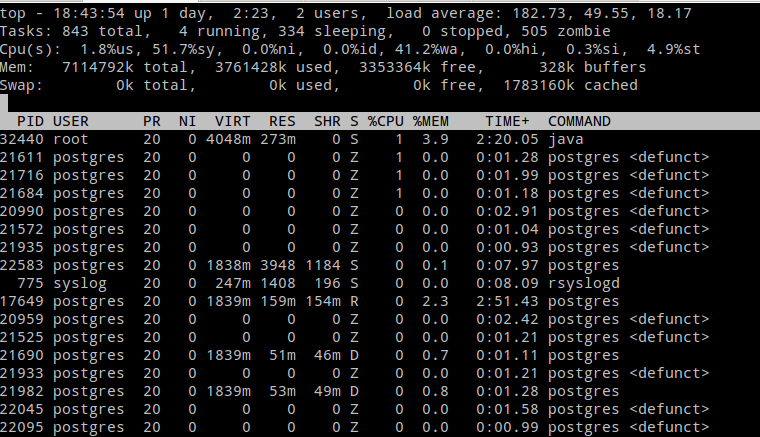
Presenter Notes
- Here's a screenshot of TOP immediately before the crash; lots of defunct postgres processes and a load average of 182.
- Not good.
Database Still Overloaded
Presenter Notes
- Increased database server size by several orders of magnitude - 68 GB of ram and 26 EC2 compute units
- DB server still slow and overloaded.. what is wrong?
- Went back and checked the math..
- Oops.. we're load testing 3x our target, swamping the servers with requests they can't process
- Make yourself a spreadsheet upfront so you don't make the same mistake I did
The Right Target Load
Presenter Notes
- database server response time is nice and fast
- redis is taking up more time than the DB again
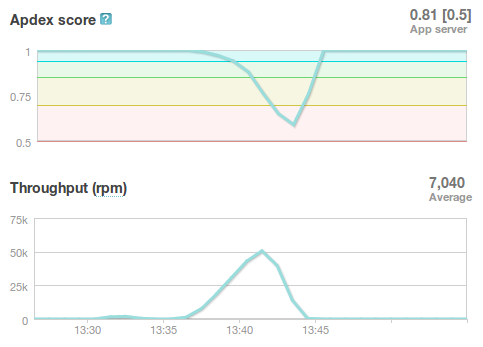
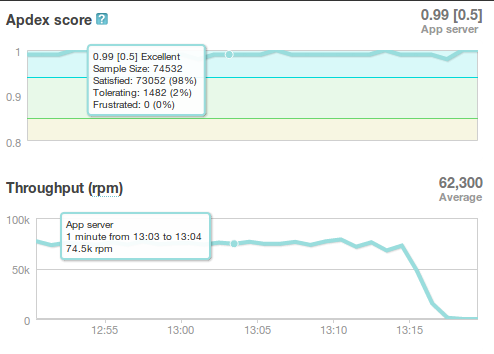
HTTP Requests
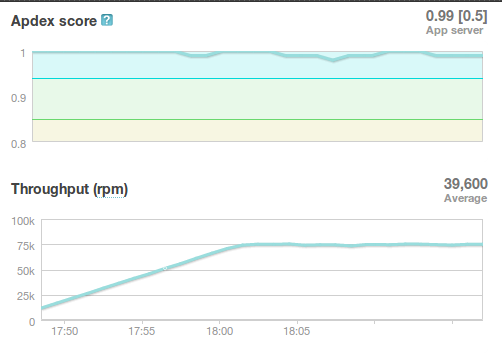
Presenter Notes
- target reqs/min are right where we want at 75,000
PostgreSQL Transactions
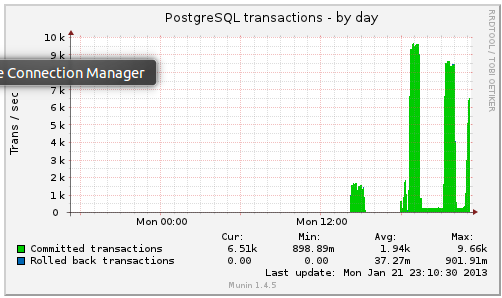
Presenter Notes
- postgresql master transactions hit over 9,500 per second
- the majority of them writes
- wow!
The Right Target Load
Presenter Notes
- You'll also notice on the last load test for survey_change_page that redis is taking up a significant amount of time
- We were still using redis for both cache and sessions at this point, and discovered that it was using near 100% of a single core on the cache server.
- Redis unfortunately is single threaded, so we swapped in memcached for the cache and continued to use redis for sessions (since it is persistent while memcached is not)
survey_change_page, with memcached
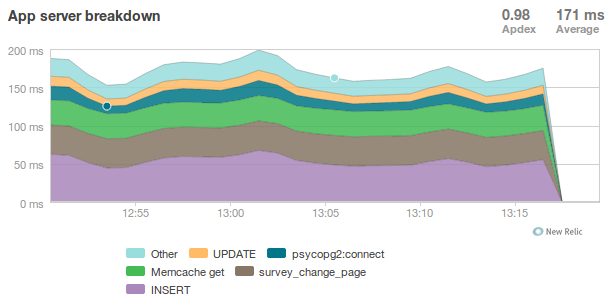
Presenter Notes
- So after we made those changes, redis disappeared from the graph and memcached took up a much more consistent chuck of the total time.
- It was also evident from the server that memcached would have no trouble saturating additional CPU cores as needed.
Final Performance
Presenter Notes
- Once again, we'd hit the necessary 75,000 requests per minute, and all the servers could be easily recreated from scratch
- For this load we ended up using about 16 extra large, high CPU instances for web servers